
The graphs on this page offer some analytics of the total SBA loan guaranty program results to provide participating lenders with a deeper understanding of what’s behind the numbers published by SBA.
By tracking the monthly total approved lending volumes, participants can assess real-time performance of the programs as an indicator of economic growth and program impact.
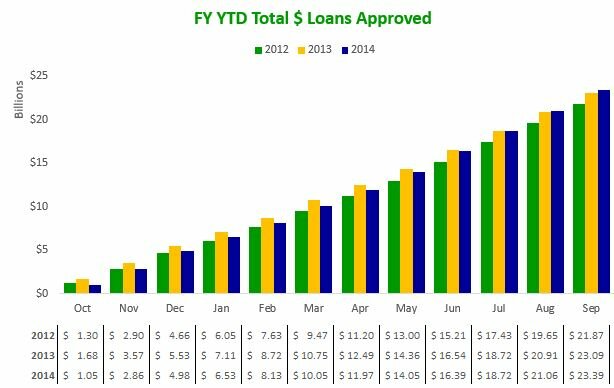
Total SBA Loans $ Approved
The first graph compares the total $ loan volume each month between the current period and the same period during the previous two fiscal years for the sum of all SBA loan program loans.
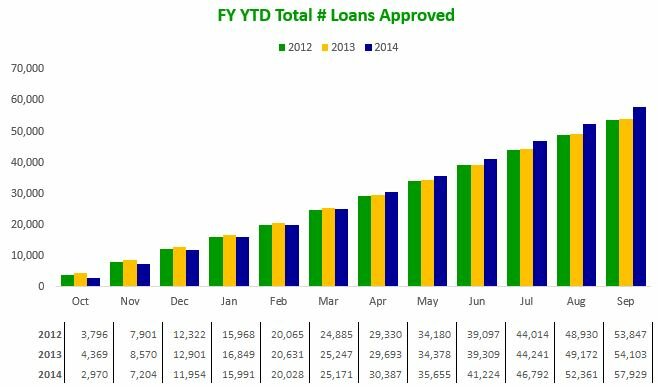
Number of SBA Loans Approved
The second graph compares the total number of transactions each month between the current period and the same period during the previous two fiscal years for the sum of all SBA loan program loans.
Average Size SBA Loans Approved
The third graph compares the average transaction size each month between the current period and the same period during the previous two fiscal years for the sum of all SBA loan program loans.

SBFI tracks a range of business lending results and lender performance through published statistics and lender surveys. Finance programs facilitated by the U.S. Small Business Administration offer a variety of financing to small business concerns for a variety of purposes. The agency publishes detailed lending activity regularly which is available at their site.
For more information contact .