
The graphs on this page offer some alternative analytics of the 504 program results to provide participating lenders with a deeper understanding of what’s behind the numbers published by SBA.
The SBA provides monthly and annual approval statistics for the 504 debenture program broken into total program $ volume and the number of debentures approved, as well as how these totals break out in various demographic categories.
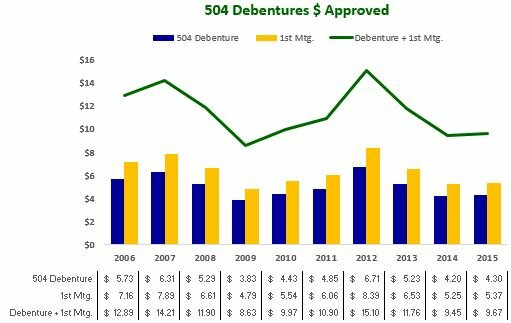
Missing from SBA’s regular report is an extrapolation of values that reflect the total sum of transaction capital volume. The graph below compares the actual 504 debenture volume against the sum of the debentures plus the estimated¹ value of the 1st mortgage financing tranche that accompanies each debenture. That total sum illuminates the true financial impact of the program.
504 Debentures $ Approved
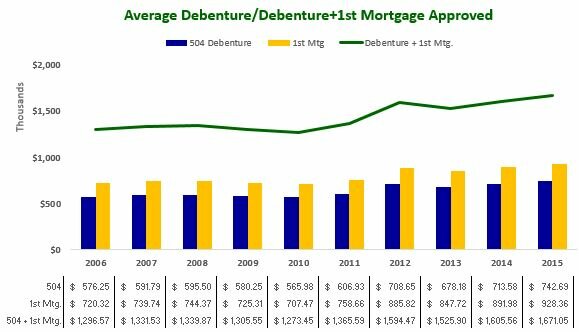
The second graph compares the average transaction size between the 504 debentures alone and the sum of the 504 debentures plus the estimated¹ value of the 1st mortgage financing tranche.
Average Debenture/Debenture+1st Mortgage Approved
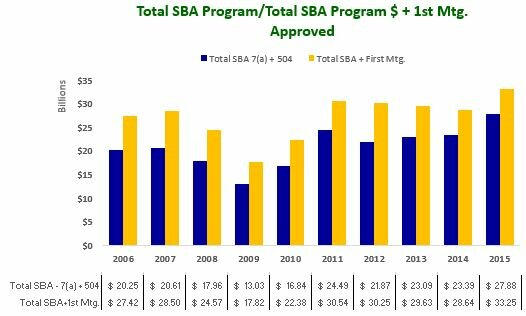
The third graph compares the value of the 7(a) loan program plus the 504 debenture volumes against the total sum of SBA program values plus the estimated¹ value of the 1st mortgage financing tranche.
Total SBA Program $ Approvals/Total SBA Program $ + 1st Mortgages Approved
SBFI tracks a range of business lending results and lender performance through published statistics and lender surveys. Finance programs facilitated by the U.S. Small Business Administration offer a variety of financing to small business concerns for a variety of purposes.
For more information contact .
¹ The estimated value of the 504 1st mortgage tranche is calculated by dividing the reported 504 debenture approvals sum by .40, representing the maximum sum the debenture can be in a transaction. The quotient of that calculation equals the estimated total project investment. Then by subtracting 10% of that sum from the total, the net calculation equals the typical debt financing sum in the overwhelming number of 504 transactions. From that typical debt financing sum, deduct the total value of the 504 debentures in order to derive the estimated 1st mortgage portion of the debt financing.